Isabel Beach
Math Fun
- Domain Colouring
- Fractals
- Geodesics
- Hyperbolic Geometry
- Lindenmayer Systems
- Matrix Substitution
- Wolfram Automata
Non-Math Fun
Pursuit Curves
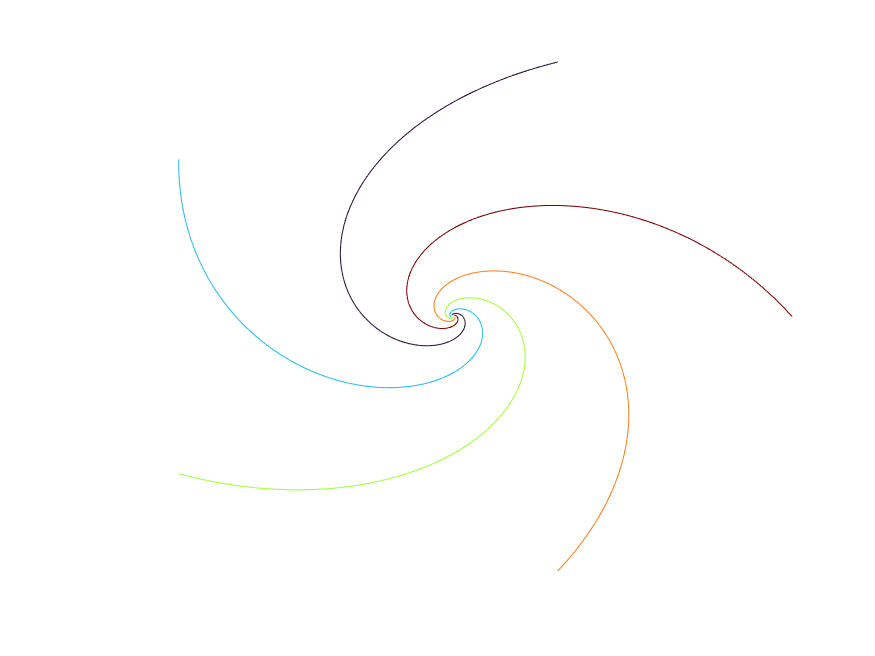
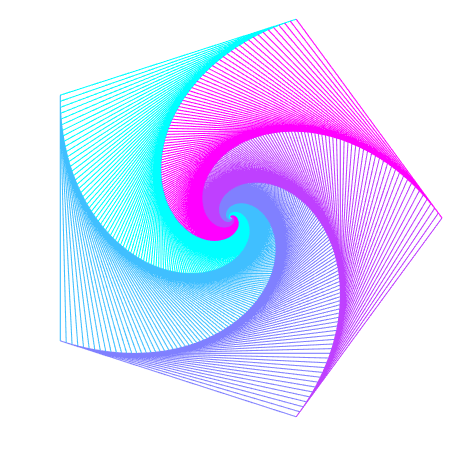
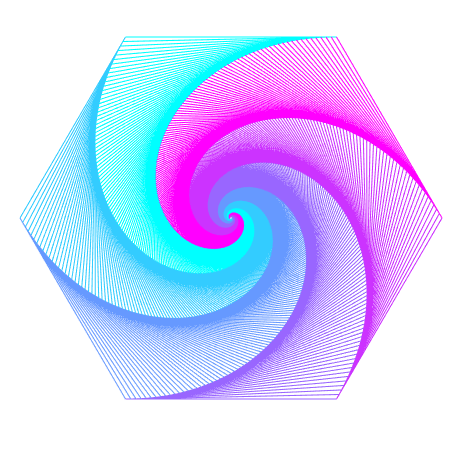
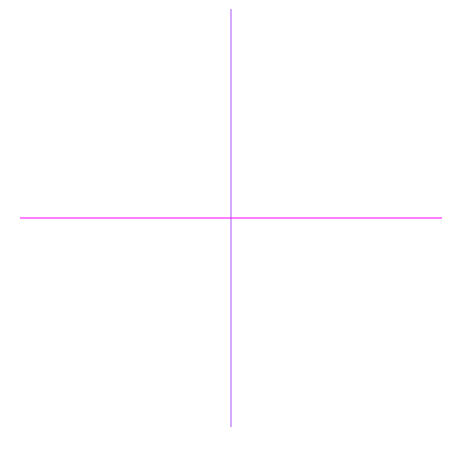
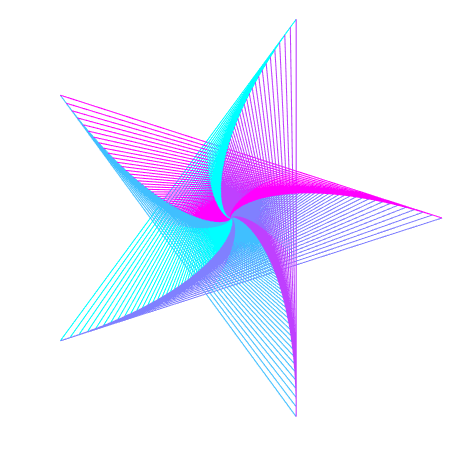
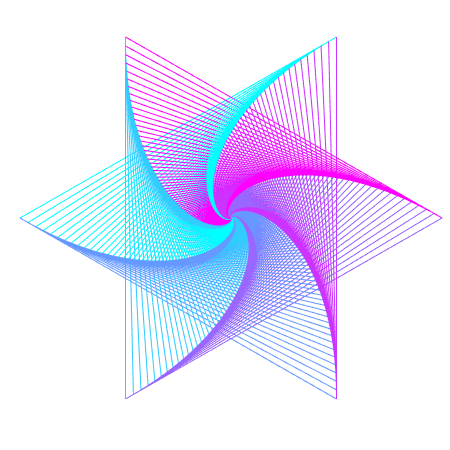
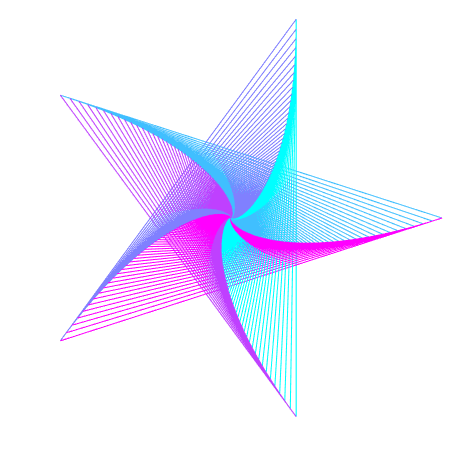
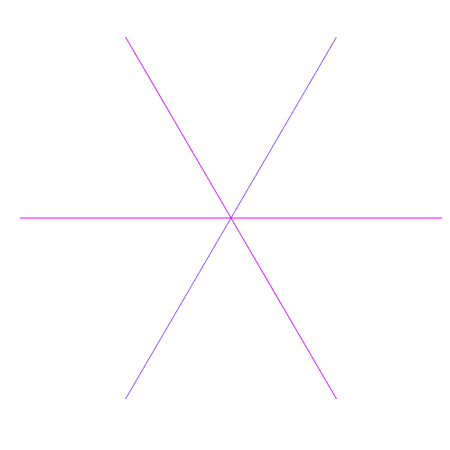
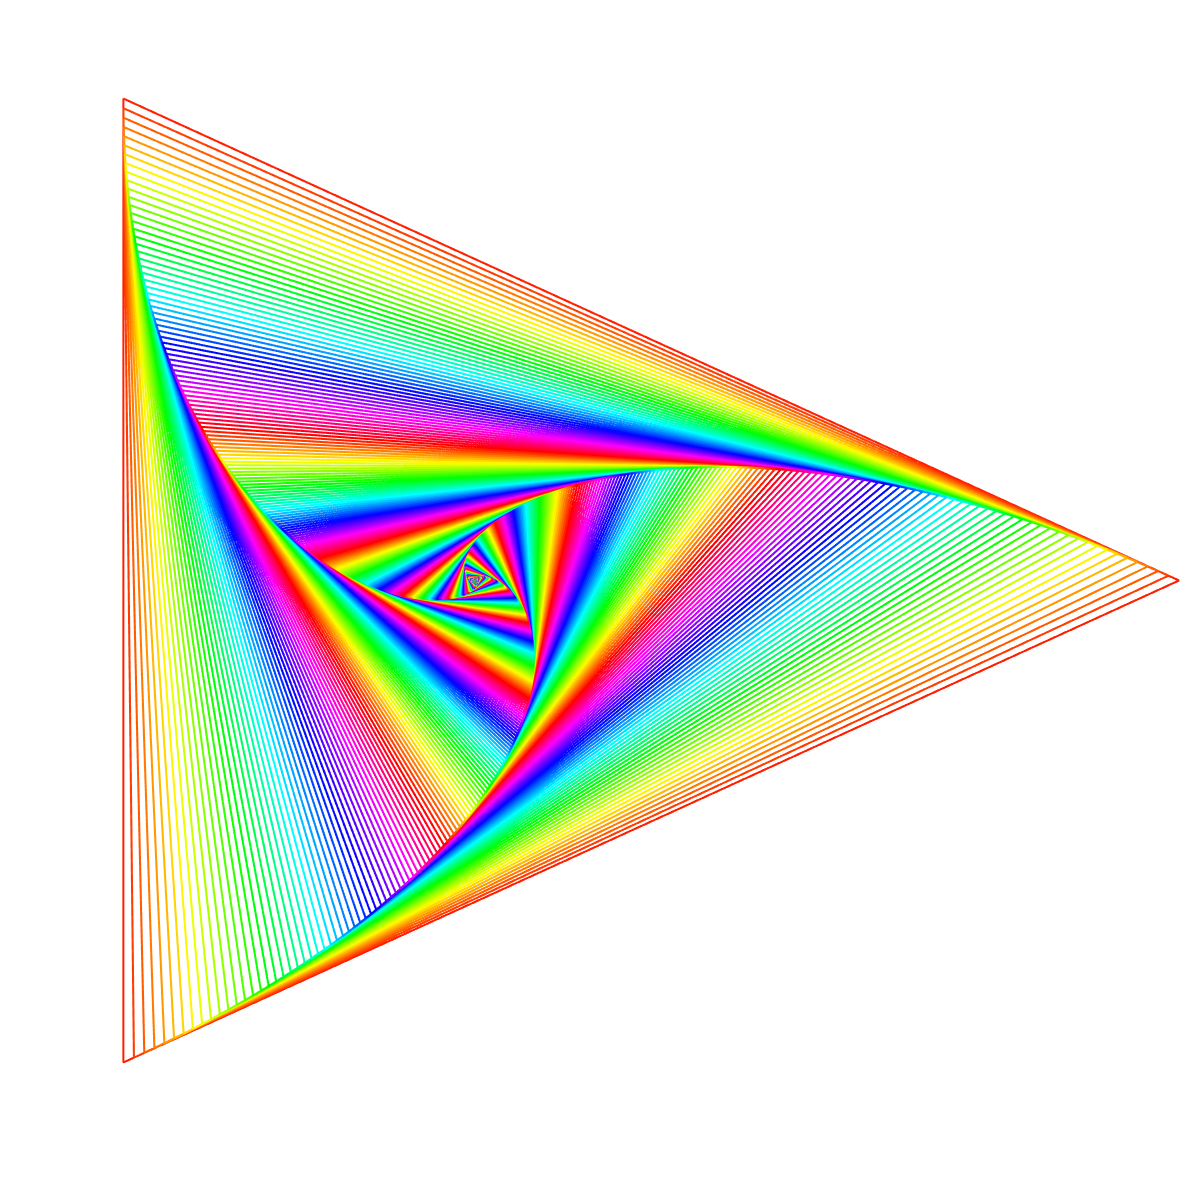
Some interesting diagrams can be made by considering “pursuit curves”. Imagine that there are some number of points representing pursuers that chase each other. At each time step, the pursuers will move towards the current position of their prey. One way to represent this data is to draw a curve representing the trajectory of each pursuer (style 1). Alternatively, at each time step we can draw a line between each pursuer and its prey (style 2). The code for these images can be found here.
| Style 1 | Style 2 |
 |
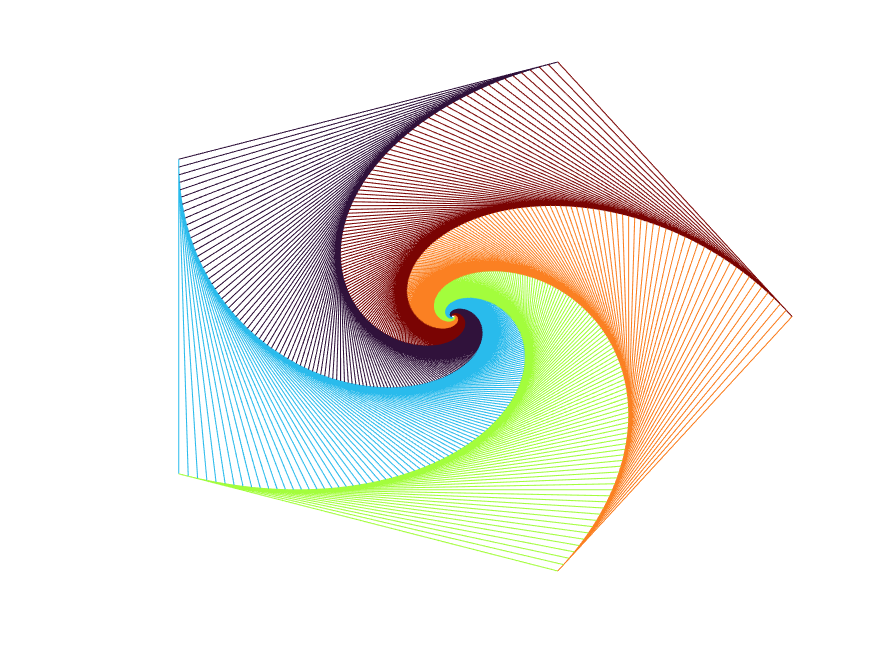 |
In the examples below, there are $n$ pursuers, and each pursuer chases the pursuer that lies $k$ places counter-clockwise from them. We pick $0<k<n$, so that a pursuer doesn’t try to chase itself.
| $n=3$ | $n=4$ | $n=5$ | $n=6$ | |
| $k=1$ | 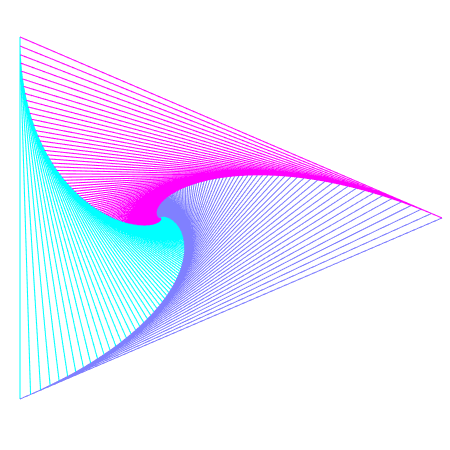 |
 |
 |
 |
| $k=2$ | 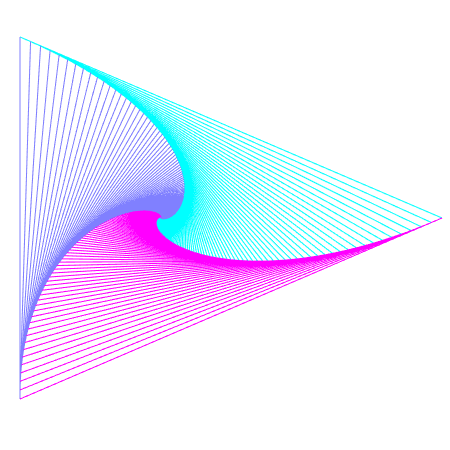 |
 |
 |
 |
| $k=3$ | 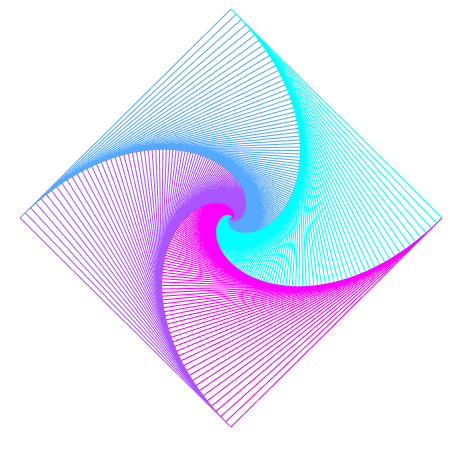 |
 |
 |
|
| $k=4$ | 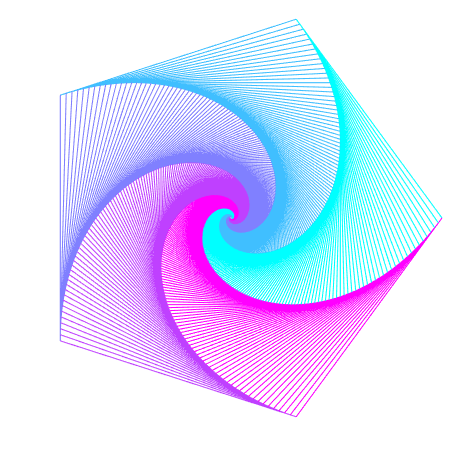 |
 |
||
| $k=5$ | 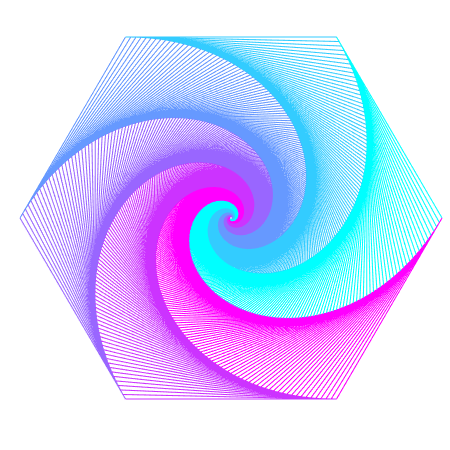 |
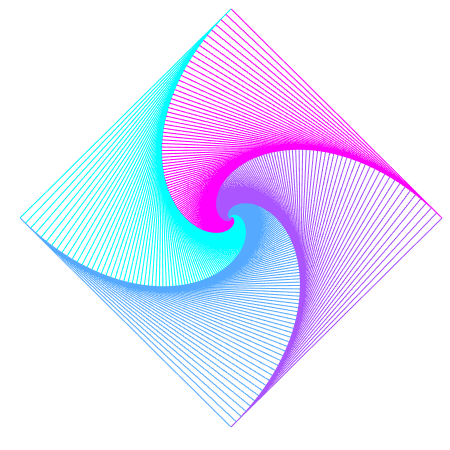
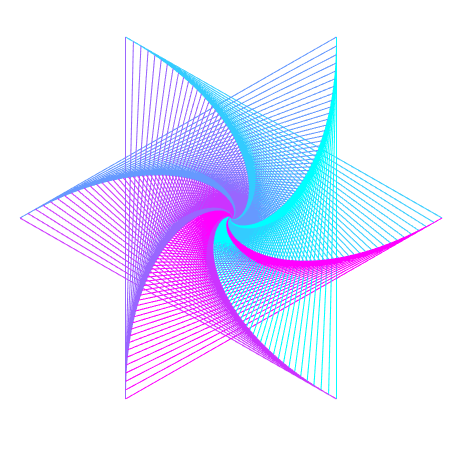
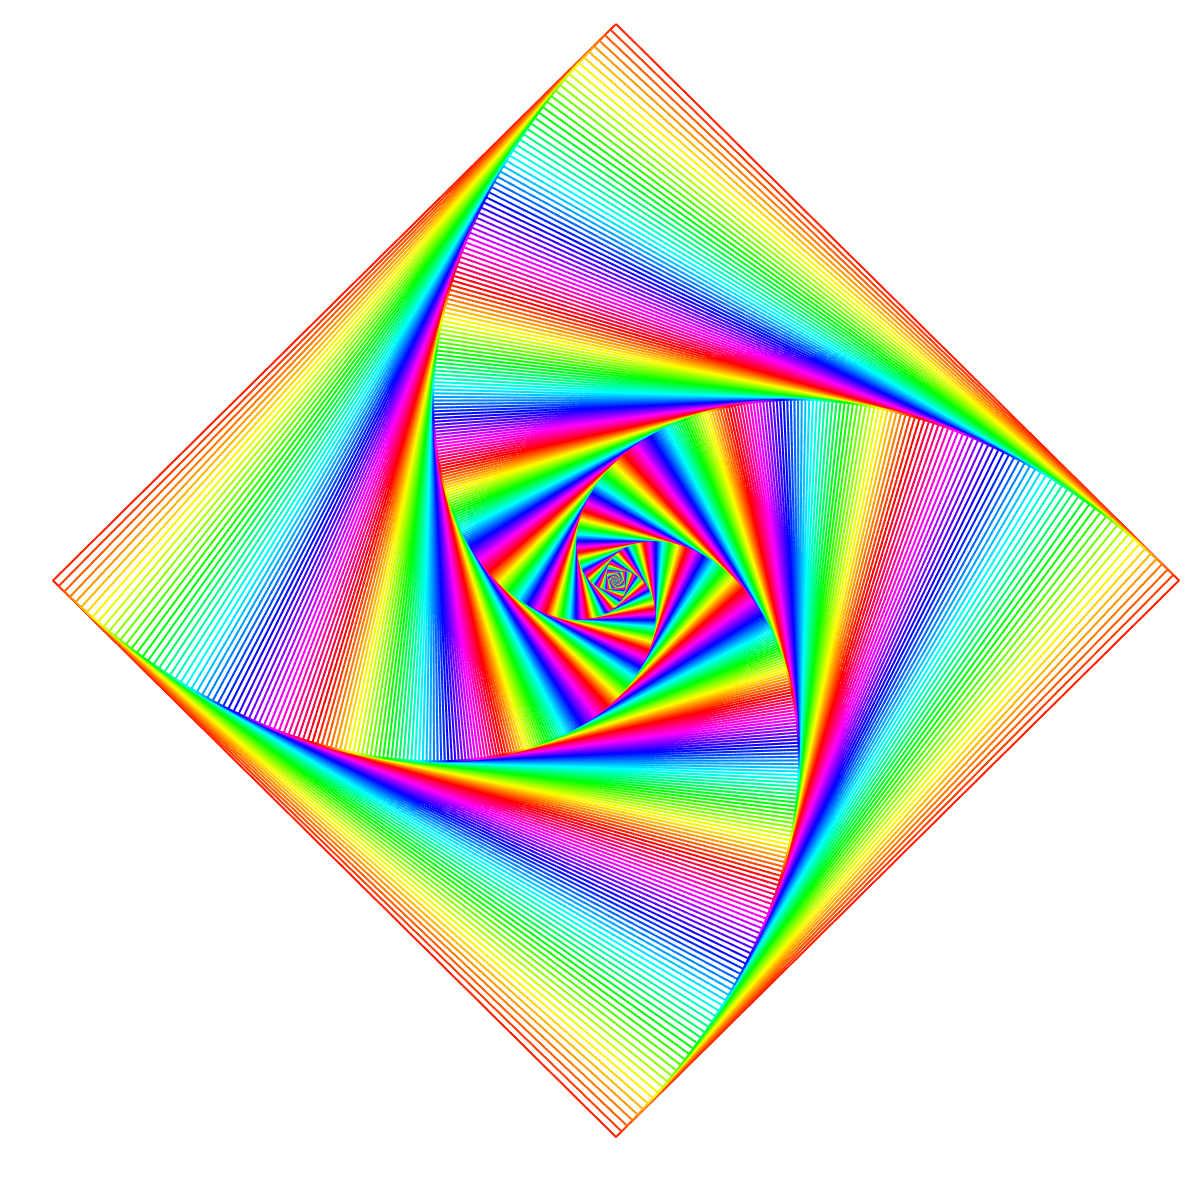
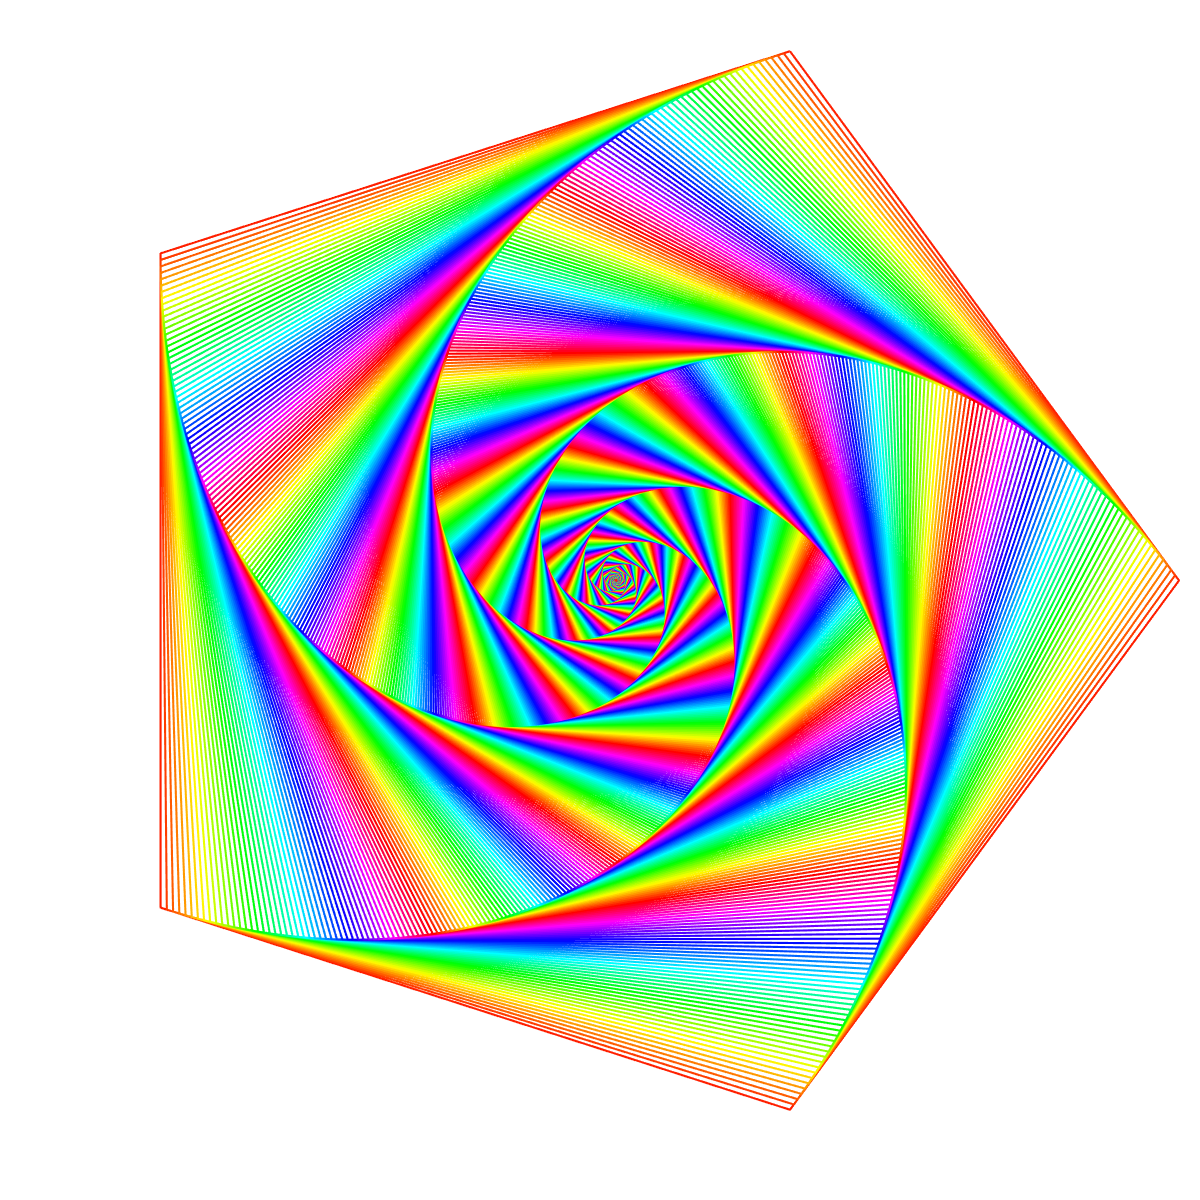
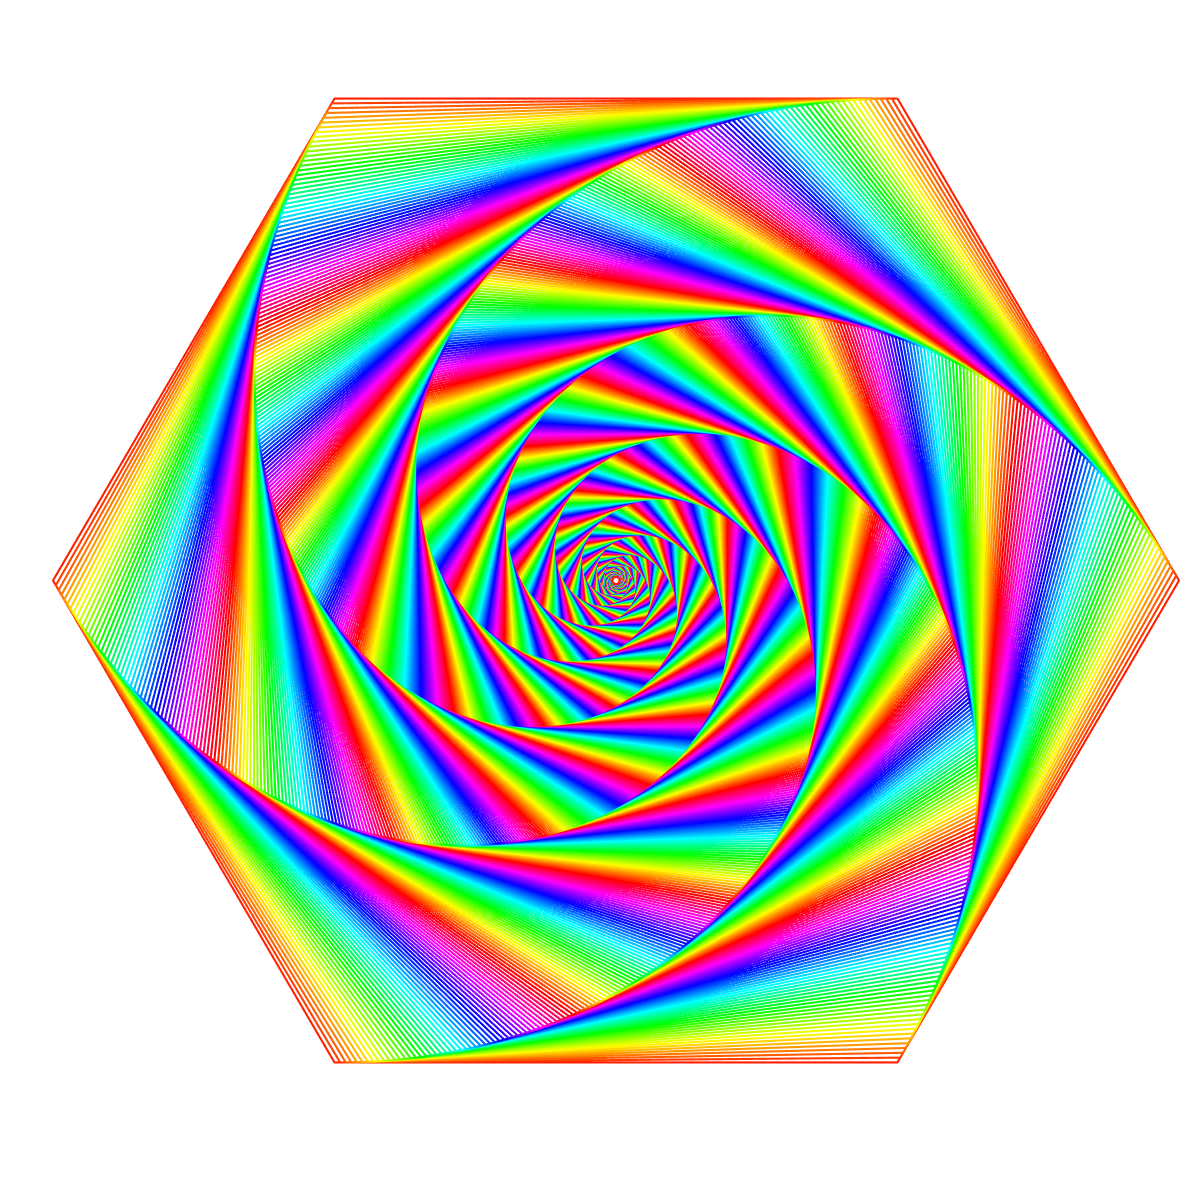
Here is a more colourful depiction of some of the above diagrams.
| $n=3, k=0$ | $n=4, k=0$ | $n=5, k=0$ | $n=6, k=0$ |
 |
 |
 |
 |