Isabel Beach
Math Fun
- Domain Colouring
- Fractals
- Geodesics
- Hyperbolic Geometry
- Lindenmayer Systems
- Matrix Substitution
- Wolfram Automata
Wildlife Photography
Domain Colouring
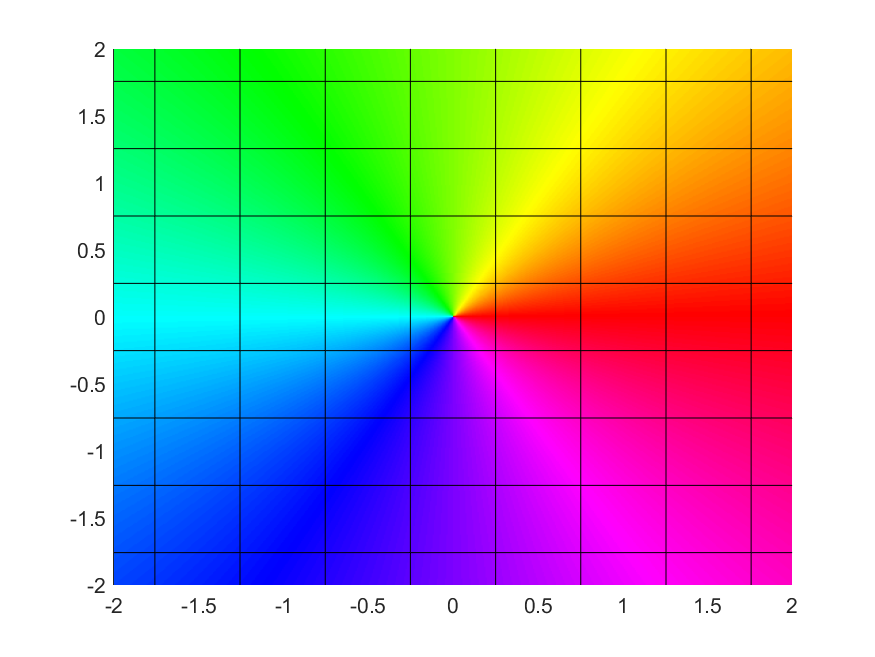
It’s not easy to graph complex functions (since such a graph would have 4 real dimensions), but the image of a complex function can still be visualized. Each point is coloured with a hue corresponding to the argument of the image of that point. For example, the image of the identity function would look like the usual colour wheel. In the case of conformal maps, it is also interesting to look at the image of a rectangular grid. The black lines are the image of a standard square grid. You can find the code for these images here.
The Identity Map
| $$z \mapsto z$$ |
|---|
 |
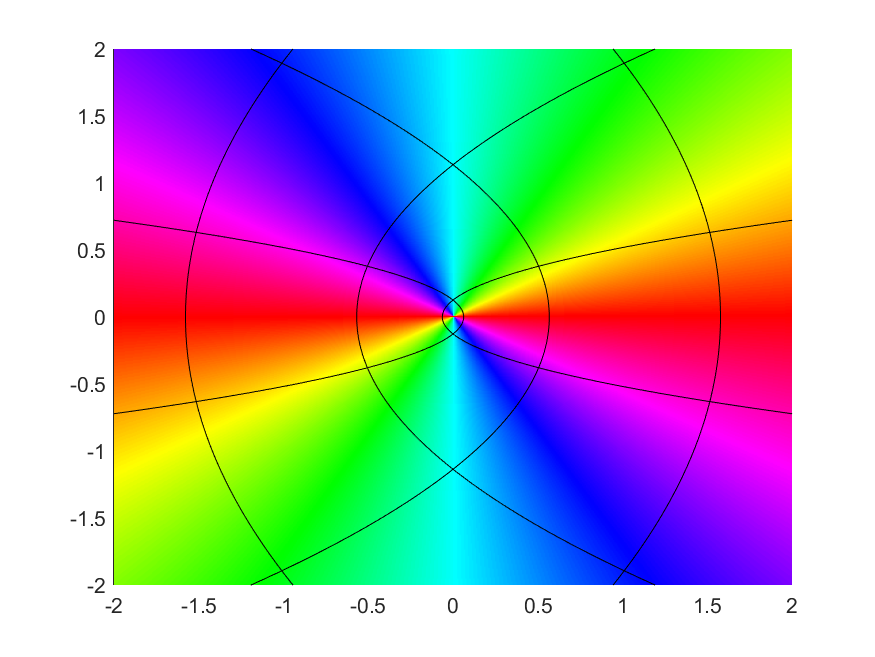
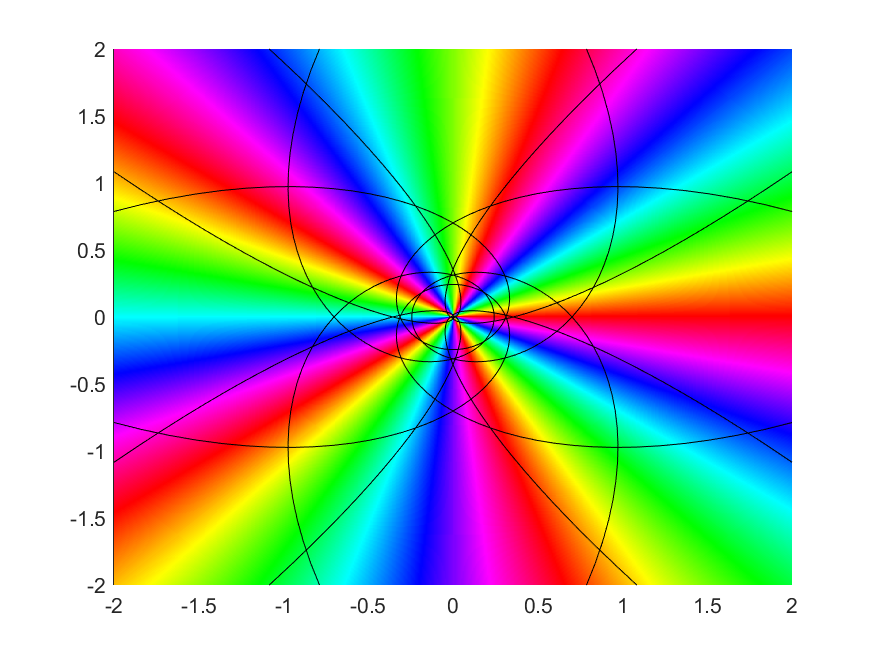
Polynomials
| $$z \mapsto z^2$$ | $$z \mapsto z^5$$ |
|---|---|
 |
 |
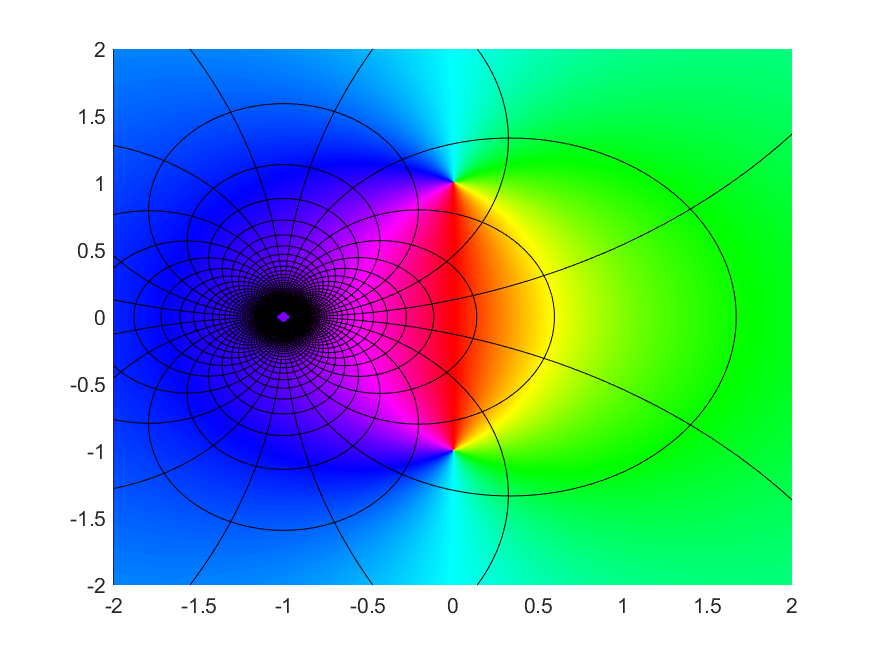
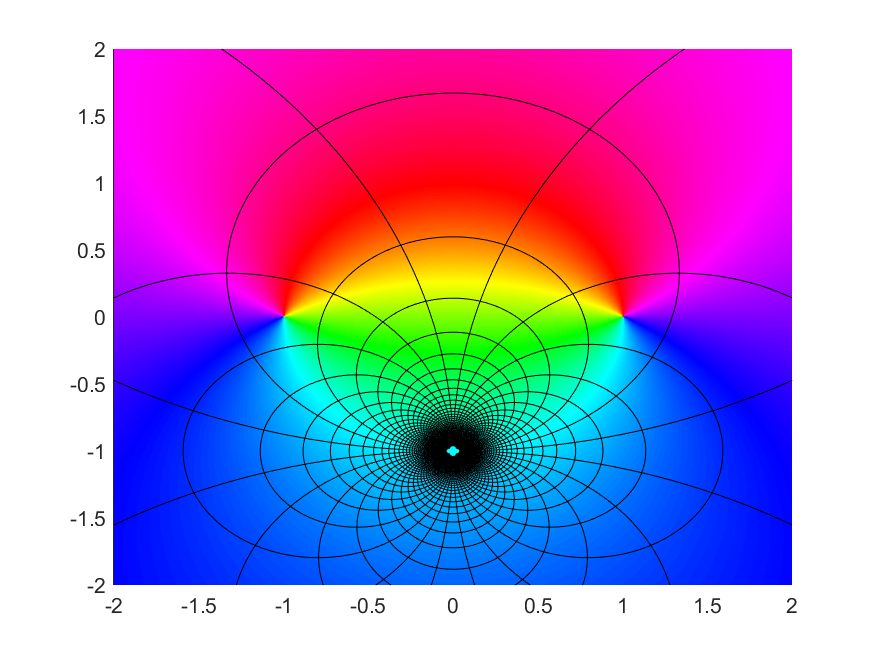
The Cayley Map
Some visualizations of the Cayley map and its inverse. The gaps are the images of a neighbourhood of infinity.
| Cayley Map $$z \mapsto (i-z)/(i+z)$$ | Cayley Map Inverse $$z \mapsto i(1-z)/(1+z)$$ |
|---|---|
 |
 |